
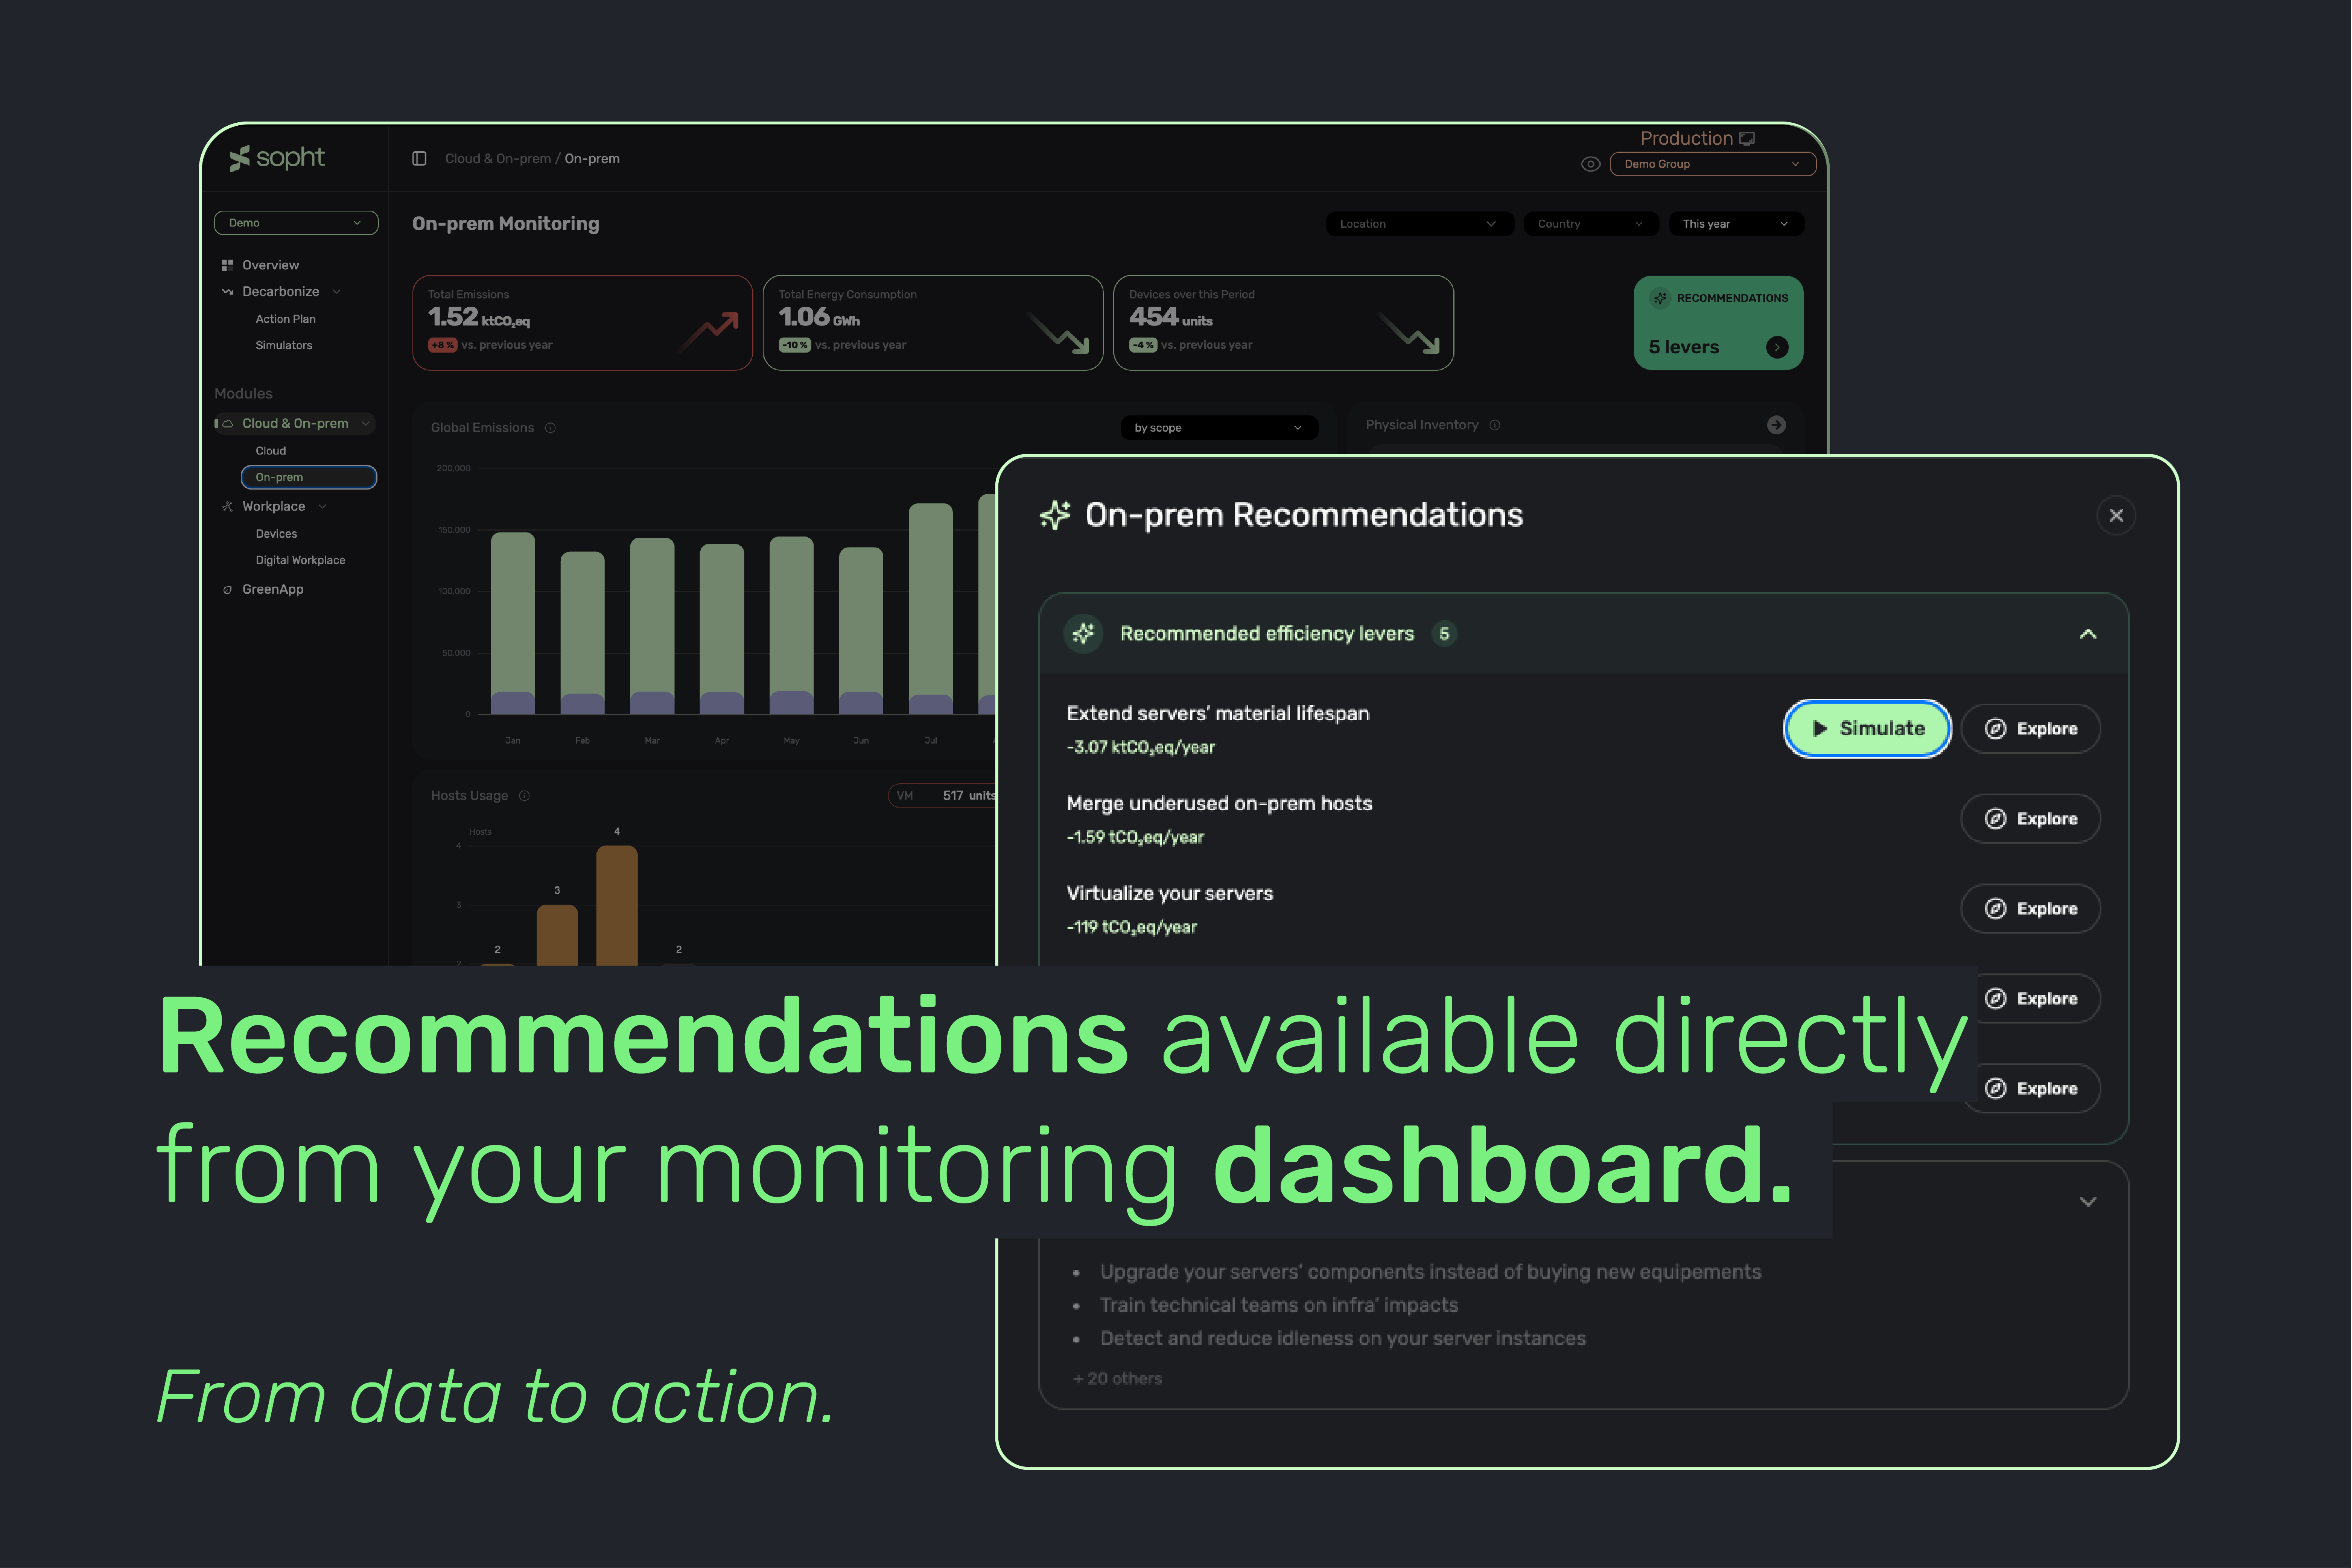
Your dashboard shows your IT emissions, month after month. Your laptop fleet weighs heavily, storage keeps growing, cloud is creeping back up. But where do you start?
In Sopht, monitoring is organized into modules, one for each major part of your IT: on-premise infrastructure, cloud, employee devices, collaboration tools and applications (GreenApp). It shows you your heaviest emission sources and feeds your reporting. But it describes a situation: it shows where emissions are, not how to bring them down.
That's where Sopht goes further: in every module, monitoring comes with quantified recommendations, so you can move from insight to action. This article explains why that matters, and how those recommendations are built.
What a quantified recommendation makes possible
Once your footprint is measured, there's no shortage of options: device lifespan, storage, server sizing… Quantified recommendations help you sort through them.
Choose with numbers, not gut feeling
Without an order of magnitude, teams go for whatever seems easiest, with no way of knowing whether that's where the biggest gain lies. With a figure next to each lever, you can see which one weighs the most, and where to start.
Start with quick wins
Many teams want low-cost actions that pay off fast before taking on heavier projects. By looking at both the estimated gain and the complexity of each lever, you can spot them at a glance.
Act without being an expert
Each lever explains why it reduces your footprint, how to implement it and which questions to ask before getting started. A team that's new to the topic knows where to begin.
Build the internal case
Leadership wants to know what a project will deliver. As an infrastructure manager at a major aerospace manufacturer told us, the hardest part is linking an action to a concrete gain so it can be defended in budget discussions.
According to Verdantix, putting a value on sustainability actions remains one of the most persistent challenges organizations face.
With both an environmental and an economic potential for each lever, IT, finance and sustainability teams look at the same lever, each through their own lens. Reducing your footprint stops being seen as just another cost.
Priorities that keep up with you
Estimates are recalculated every month. If your device fleet or cloud usage changes, your priorities follow.
Recommendations right where you monitor your emissions
On every monitoring screen, a card shows how many levers are recommended for you. One click opens the list, with the estimated reduction for each lever in tonnes of CO₂ per year.
Open a lever to see its details. From there, you can test a scenario in the simulator, create an action, or dismiss the lever if it doesn't apply to you.
What's behind each recommendation
Behind every lever you see, there are four steps: making data comparable, drawing on a library of levers, highlighting the highest-priority ones, and quantifying their potential using your own data.
Making data comparable
It all starts with data, and that data comes from the tools you already use.
For laptops and on-premise servers: your IT asset management tool (such as Intune or ServiceNow), your virtualization platform (vCenter), or an inventory file.
For collaboration tools: Microsoft 365 or Google Workspace.
For cloud: billing and usage data from your providers (AWS, Azure, Google Cloud, Oracle Cloud).
Cloud adds a challenge: every provider presents its data differently. A virtual machine is called EC2 on AWS, Virtual Machines on Azure and Compute Engine on Google Cloud, and the columns, units and region codes differ too. Sopht therefore organizes this data into a common format inspired by FOCUS, the open standard backed by the FinOps Foundation.
This data is first used to calculate your footprint, using a methodology based on recognized frameworks such as the GHG Protocol, ADEME's Base Carbone and Boavizta.
The maximum reduction potential of each lever is calculated with the same rules as your footprint. So you can compare it directly with your emissions, for example to see that a lever could cut up to 5% of your footprint. And because the calculation starts from your own data, you can identify the levers that will have the most impact in your context, not in that of a typical company.
A library of levers
Sopht then draws on a library of more than sixty reduction levers, organized by module: virtualizing servers, consolidating underused ones, detecting unused virtual machines, extending hardware lifespan…
Each lever is documented and rated on three criteria: environmental potential, economic potential and complexity.
A selection of priority levers
From this library, Sopht highlights the priority levers for each module, for example 5 out of 28 for on-premise infrastructure. The others remain available. What changes from one organization to another is the estimate: each lever's gain is calculated using your own data.
An estimate based on your own data
We start from your current situation, measured on your data, and compare it with what it would be if the lever were applied in full. That gap, converted into CO₂ (and into euros where possible), is the reduction potential: what the lever could help you save.
An example: devices per employee
A company of 2,000 people has 1.2 devices per employee. If the target is one device per person, that's 400 devices too many. Multiply that by the footprint of one device (its manufacturing and electricity use) and you get the reduction potential in tonnes of CO₂.
Every lever follows the same logic, with its own indicator: storage volume, share of devices recycled at end of life, server size relative to actual usage.
What makes the figure reliable
The calculation is based on your data history, not on an industry average. And when data is insufficient, only reliable estimates are shown.
An order of magnitude to decide
The gain shown is everything a lever represents for you, if it were applied across the board. In practice, depending on your technical constraints, budget or timeline, the gain you achieve will often be smaller.
But for making decisions, that's exactly what you need: knowing that one lever weighs ten times more than another tells you where to start.
Every estimate is documented: methodology, version, data period. You know where each figure comes from and can explain it, to your leadership or in a sustainability report.
Start with the biggest opportunities
You don't need a perfect plan to get started. What matters is knowing where the biggest opportunities are, and which ones are within reach.
With levers and their estimated gains right next to your numbers, monitoring becomes the starting point for action.
Curious to see how it works? Book a demo