
There is a scene that exists in many organizations, one that everyone recognizes but no one really documents: a performance incident is detected in the observability platform.
At the same time, another tool is opened to check cloud costs, then a third one to assess carbon impact. Three dashboards, three contexts, three tools, and a decision that could have been made from a single interface.
The problem is not the data itself, but how fragmented it is.
The operational tool sprawl
The accumulation of multiple tools designed for similar IT monitoring and management processes is known as tool sprawl.
This is a real and well-documented issue. A recent CNCF survey revealed that 72% of respondents use up to nine different tools in their observability stack, while more than one-fifth use between ten and fifteen. Half of the participants identified tool sprawl as one of the biggest obstacles to their observability efforts, making it the most commonly cited challenge across organizations.
The phenomenon is declining, but slowly. New Relic’s Observability Forecast 2025 report, based on insights from 1,700 IT leaders and engineers, recorded a 27% decrease in the average number of tools used over two years, bringing the average down to 4.4 tools.
The shift has begun, but for teams themselves, it remains insufficient: more than one organization out of two (52%) lists consolidation toward a unified platform among its explicit priorities.
And the issue extends far beyond observability. In 2024, Forrester estimated that 77% of U.S. technology decision-makers reported moderate to high levels of technology sprawl across their entire stack, with 63% already engaged in consolidation initiatives. Observability is only one particularly visible example of a broader fragmentation problem.
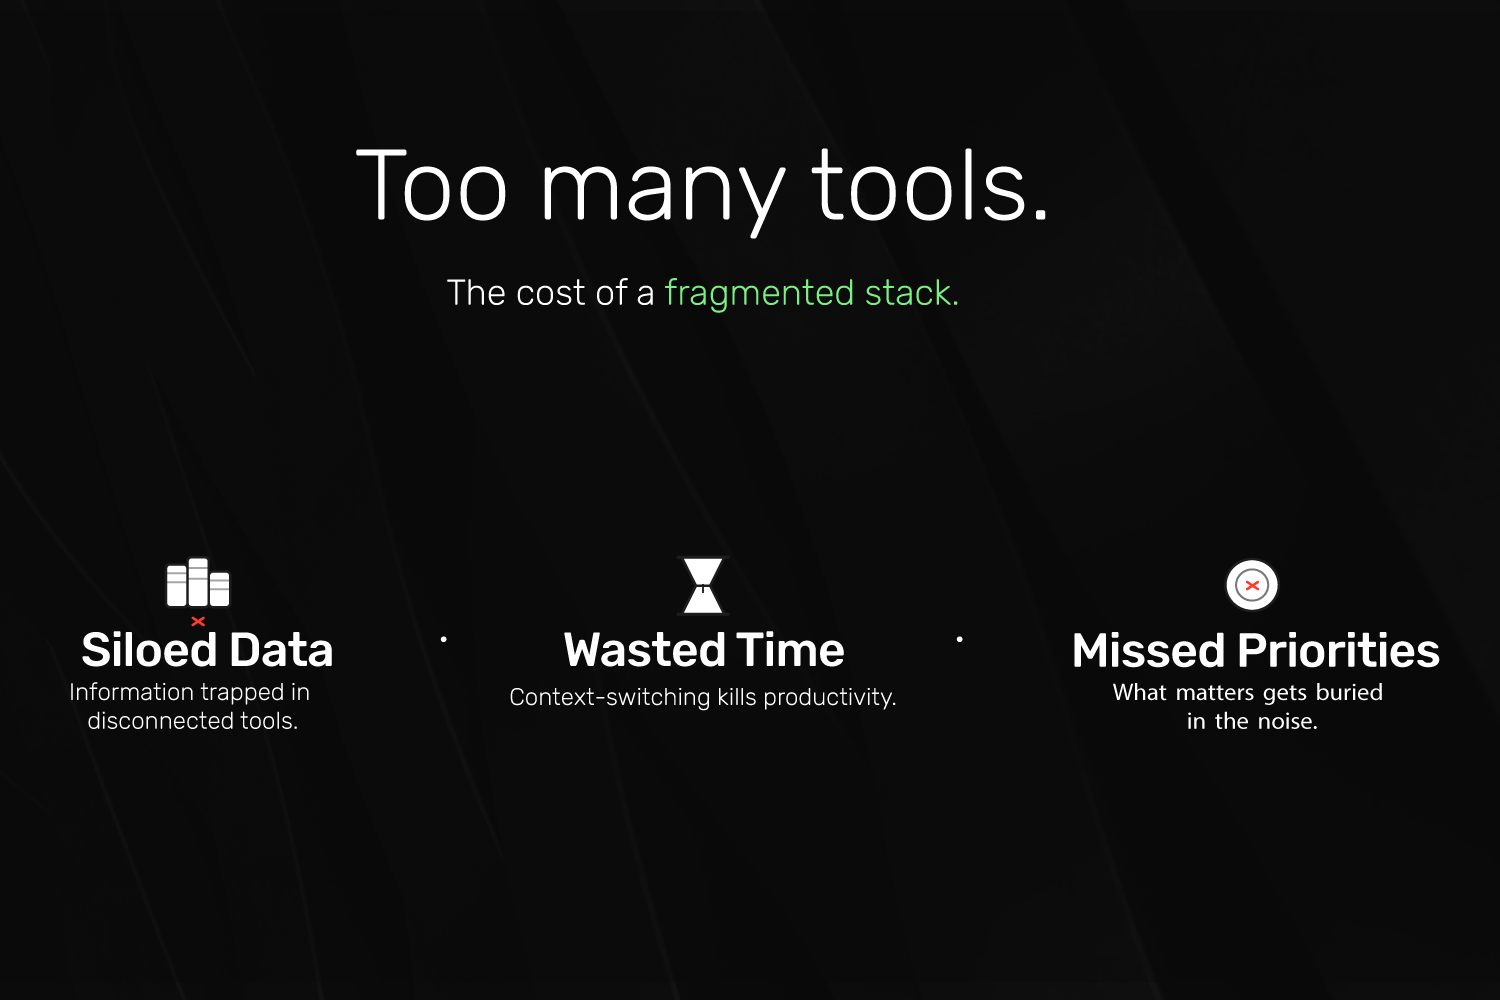
The consequences of this accumulation are well known to operational teams. First, there is context switching, which consumes attention precisely when incidents require maximum focus. Then comes siloing: logs, metrics, and traces exist in separate environments, and correlations that should be obvious become a manual cross-referencing exercise. Finally, redundant alerts cascade across multiple systems for the same event, eventually reducing teams’ ability to react effectively.
Meanwhile, the decision to act and optimize, the ones that could simultaneously reduce costs and environmental impact, remains delayed.
Performance, costs, carbon: three problems or just one?
What makes this situation particularly frustrating is that the three dimensions, application performance, cost optimization, and carbon footprint reduction, all rely on the same underlying data.
The fundamental driver behind both FinOps and GreenOps is identical: efficient resource utilization.
An idle virtual machine wastes money, part of the estimated $44.5 billion in cloud waste projected for 2025. It also wastes the electricity powering it and the cooling systems required to maintain it. When this waste is eliminated, organizations save money and reduce carbon emissions at the same time.
Both FinOps and GreenOps teams rely on the same telemetry data: CPU usage, storage activity, network throughput, and scaling patterns.
Cloud providers have already understood this overlap, which is why platforms like AWS position their carbon footprint tools alongside cloud cost management dashboards, enabling users to instantly identify both cost and carbon impacts. However, most organizations today operate in multi-cloud environments. In these contexts, tool sprawl remains fully intact, and is even worsened by carbon accounting methodologies that vary from one provider to another.
Optimization efforts can often lead to simultaneous reductions in both costs and environmental impact, for example by shutting down unused virtual machines or improving resource usage monitoring.
The question is therefore not whether organizations should prioritize performance, costs, or sustainability. It is about stopping treating them as three separate challenges requiring three separate tools.
Why observability platforms are becoming the natural control center
ITOps teams already have their primary operational platform. It is where they spend their days, where they detect incidents, and where they analyze system behaviors. Modern observability platforms already centralize metrics, logs, traces, and application topologies.
Observability is becoming essential for any serious IT sustainability strategy. Rather than simply producing IT carbon reports, the real challenge is leveraging observability tools to optimize energy consumption and reduce carbon footprints, while simultaneously lowering operational costs and meeting regulatory requirements.
Precisely because these platforms already centralize infrastructure visibility, they are the natural place to integrate dual-benefit optimization recommendations: cost and carbon reduction. Not in an external tool that teams must consult separately, but directly within the workflow of the engineer already managing system performance.
Projects such as Kepler, a CNCF Sandbox project, already enable organizations to monitor energy consumption in cloud-native environments by quantifying energy usage across nodes, containers, and virtual machines.
By integrating energy telemetry with system metrics, organizations can correlate performance with environmental cost, enabling smarter trade-offs that prioritize efficiency without sacrificing reliability.
Managing everything from the same place
Integrating decarbonization recommendations into an existing observability platform is not about adding another tool. It is about making visible a dimension that was already there, but previously unreadable.
For an ITOps profile, this means that while using the same interface to detect performance degradation, they can also identify overprovisioned instances, services consuming energy without justified workloads, and actions that would simultaneously reduce both cloud bills and carbon footprints.
New optimization levers are emerging in this context: carbon-aware scheduling, geographic workload placement based on local grid carbon intensity, and automated shutdown of non-production environments.
For infrastructure leaders or CIOs, it ultimately means one thing: no longer having to choose between the performance tool and the sustainability tool.
Tool rationalization is only effective when it is accompanied by genuine integration between observability and ITOps. Otherwise, consolidation decisions remain driven by personal preferences rather than actual business value.
The market signal is clear
Observability maturity is now commonly defined across five levels, ranging from reactive ad hoc practices to fully optimized, AI-driven operations. Most organizations currently sit somewhere in the middle of this spectrum, and the organizations progressing the fastest are those investing in integration and automation to streamline workflows.
In 2025, sustainability has become a central concern for organizations facing increasing energy demands from cloud environments and AI-driven operations. Observability platforms are becoming essential for monitoring and optimizing the energy consumption of AI workloads, identifying inefficiencies, and enabling intelligent workload distribution.
The convergence is already underway. Teams that anticipate it will not have to choose between reducing costs and reducing environmental impact. They will achieve both from the same place, using the same data, at the same moment.
Organizations pursuing either FinOps or GreenOps often discover that they are already doing a large part of the work required for the other. This overlap means that teams no longer need to choose between financial efficiency and environmental responsibility.
Tool sprawl is not inevitable. It is the legacy of an era in which performance, costs, and sustainability each had their own dedicated tool, but they can now converge into a single platform.