Data centers play a pivotal role in the digital realm, storing, managing, and providing access to data on a grand scale. However, their operations significantly impact the environment due to their high energy demands. To assess and enhance the energy efficiency of data centers, several key indicators have been developed. In this article, we delve into three of these crucial indicators: Power Usage Effectiveness (PUE), Carbon Usage Effectiveness (CUE), and Water Usage Effectiveness (WUE). Each of these indicators provides a unique perspective on the environmental performance of a data center, and understanding them is crucial to minimize environmental impact while ensuring operational efficiency.
Power Usage Effectiveness (PUE)
PUE stands as one of the most commonly used indicators to assess the energy efficiency of data centers. Developed by The Green Grid, a non-profit organization focused on data center energy efficiency.
However, PUE alone does not address electricity-related pollution, equipment usage practices, or the impact of the data center’s location, among other factors. Therefore, it should not be the sole consideration for decision-making, offering only a partial insight into a data center’s energy performance.
To delve deeper, PUE can be further broken down into different “tiers”:
-
Tier 1:
- PUE: Generally above 1.15.
- Characteristics: Basic infrastructure, but may lack significant redundancy, leading to interruptions for maintenance or repairs.
-
Tier 2:
- PUE: Generally between 1.10 and 1.15.
- Characteristics: Adds some redundancy compared to Tier 1, typically featuring redundant cooling and power systems to reduce the risk of interruptions.
-
Tier 3:
- PUE: Generally between 1.05 and 1.10.
- Characteristics: Offers considerable redundancy in power and cooling, allowing uninterrupted operation during outages or maintenance.
-
Tier 4:
- PUE: Generally between 1.02 and 1.06.
- Characteristics: The highest level of redundancy, designed to be fault-tolerant with exceptionally high availability, featuring fully redundant electrical and cooling systems to minimize disruptions.
While PUE remains a valuable tool for evaluating and improving data center energy efficiency, it has limitations:
- Sole focus on energy efficiency, neglecting other sustainability aspects.
- Dependence on precise measurement data.
- Difficulty in comparing different data centers.
- Failure to consider geographical location and climate variations.
How to Use PUE: PUE measures the total energy consumed by a data center, including servers, cooling equipment, lighting, and other loads, relative to the energy consumed only by active computer servers. A lower PUE indicates a more eco-friendly data center. According to a Uptime Institute study, the average PUE in 2021 was 1.57, compared to 2.5 in 2007.
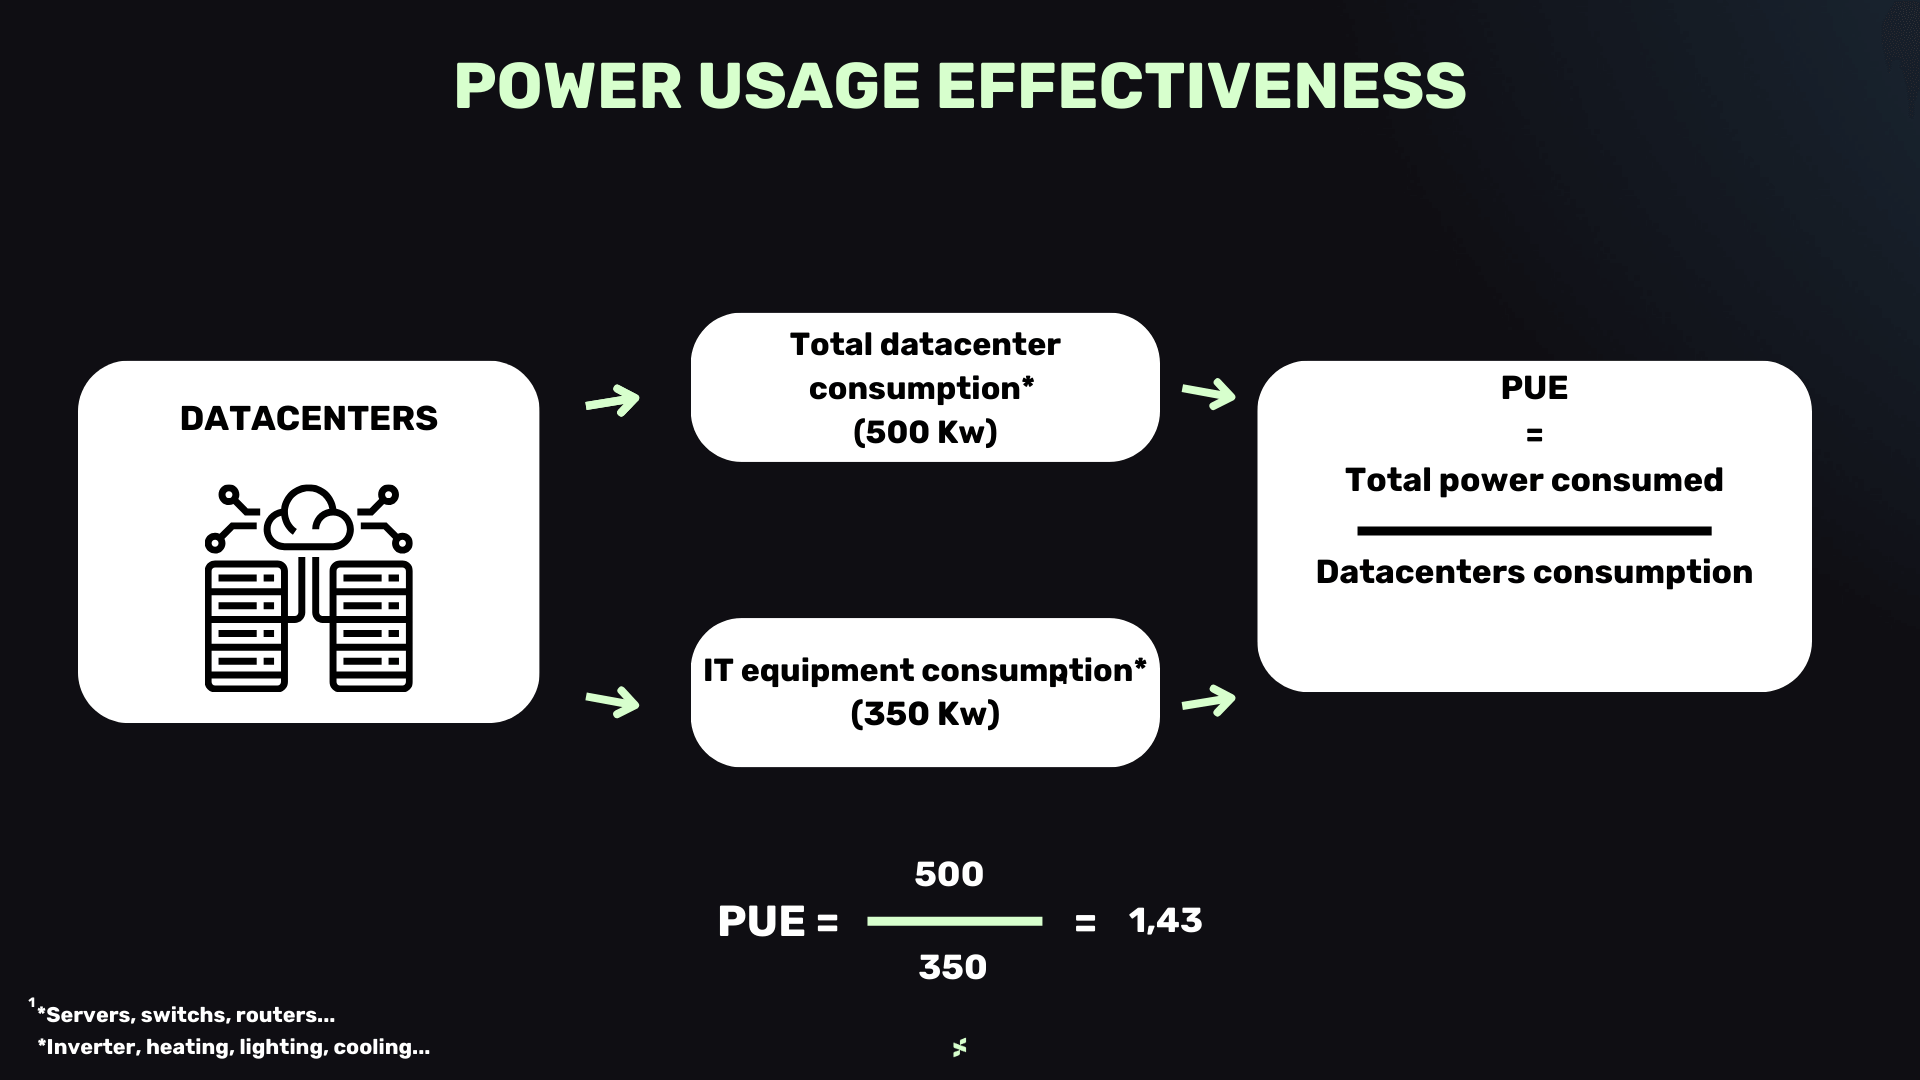
Example: If a data center has a total energy consumption of 500 kW and server energy consumption of 350 kW, its PUE would be 1.43 (500 kW / 350 kW). This means that 43% of the total energy is used for non-server needs. The goal would be to reduce this proportion by improving overall energy efficiency.

Carbon Usage Effectiveness (CUE)
CUE measures the carbon footprint of a data center by assessing CO2 emissions per unit of energy consumed. It considers both direct and indirect emissions associated with the entire life cycle of the energy used.
However, it is challenging to take this indicator seriously due to the myriad methods allowed in carbon accounting, with no established standard. It also does not account for the carbon emissions impact related to construction, purchase of IT equipment, or their transportation.
How to Use CUE: A low CUE indicates that the data center produces few CO2 emissions per unit of energy, desirable for reducing environmental impact. Organizations can use CUE to track progress toward more environmentally friendly operations and determine if adjustments are necessary to reduce carbon emissions.
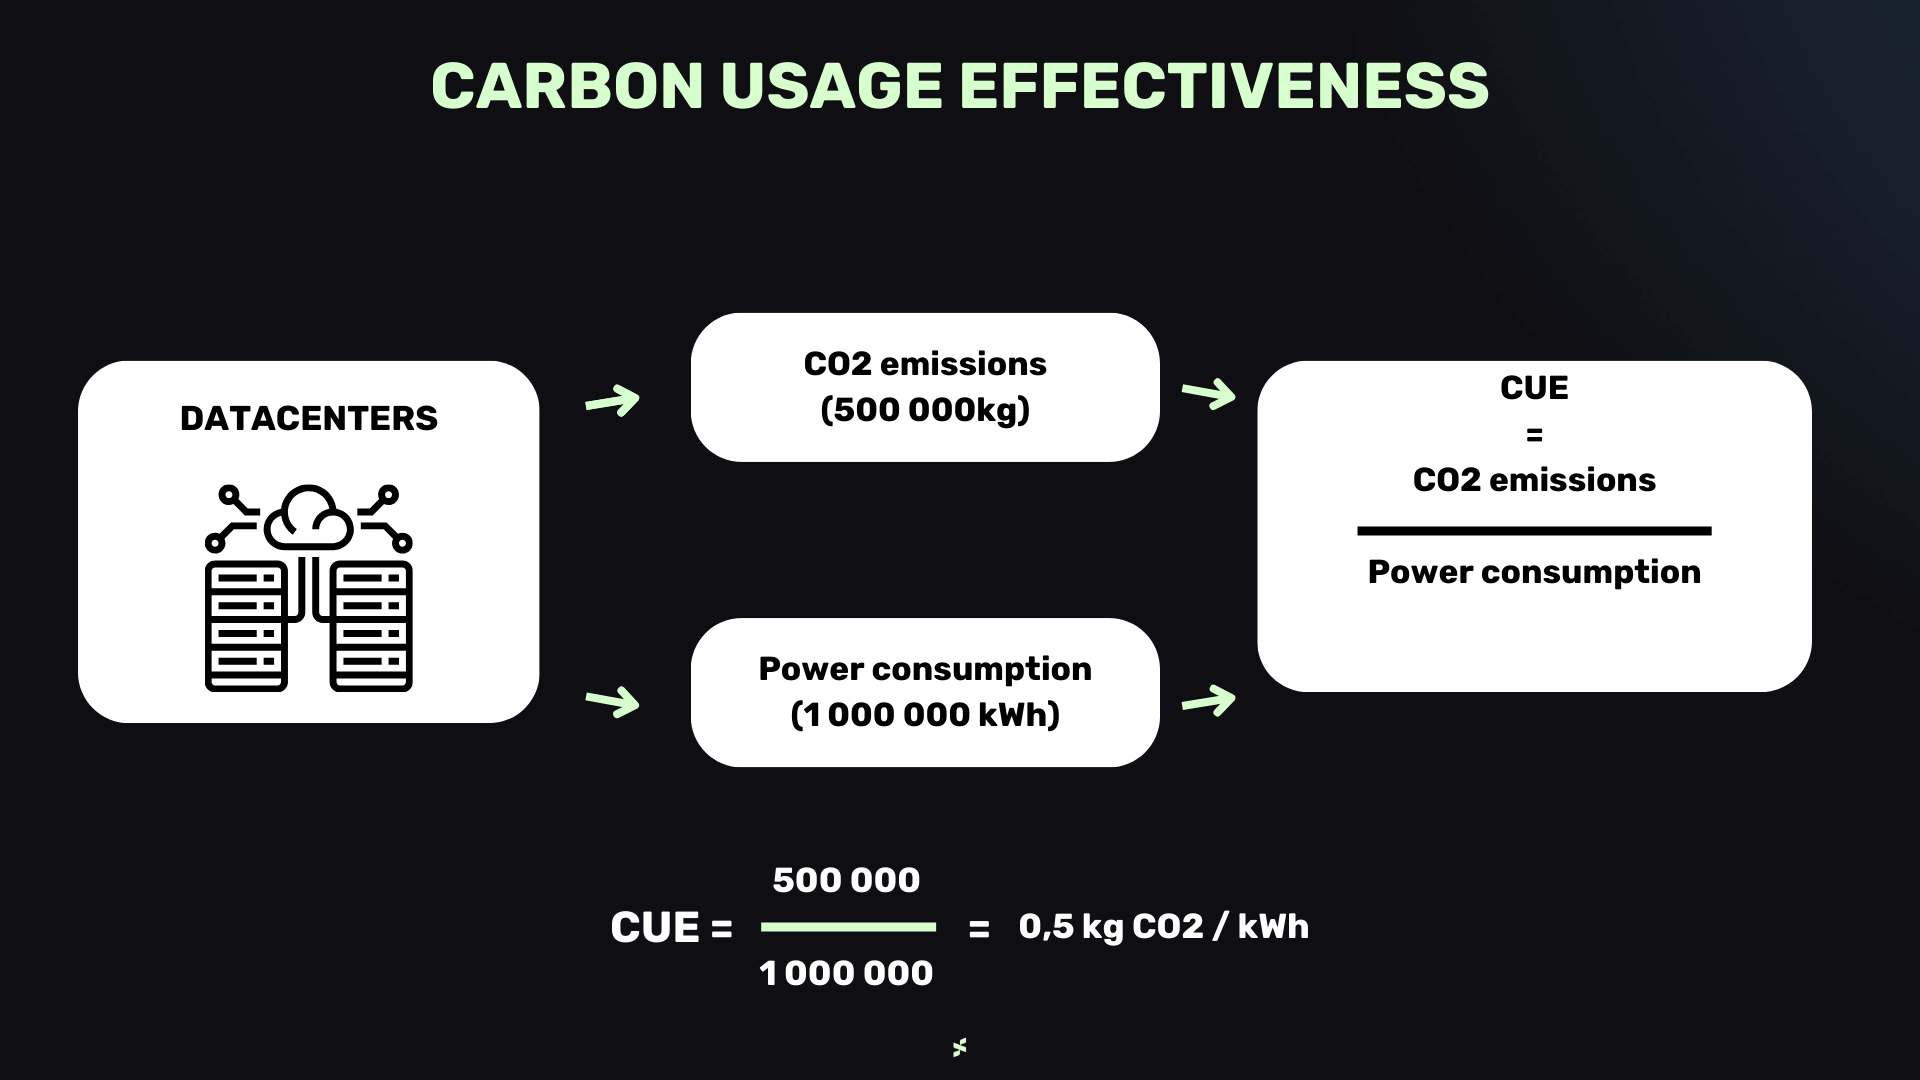
Example: Suppose a data center emits 500 tons of CO2 per year and consumes 1,000,000 kWh of electricity. Its CUE would be 0.5 kg of CO2 per kWh (500,000 kg / 1,000,000 kWh). To reduce its carbon footprint, the data center could consider using renewable energy sources or improving the energy efficiency of its infrastructure.

Water Usage Effectiveness (WUE)
WUE assesses a data center’s water consumption by dividing it by the unit of energy produced or processed. This indicator measures the efficient use of water in data center operations.
On its own, WUE has limited relevance, gaining value only when used in conjunction with other indicators. Moreover, it is still infrequently employed, making comparisons challenging.
However, accurately measuring WUE is crucial to avoid disasters like Microsoft’s in 2022 after the underestimation of water consumption in one of its data centers in the Netherlands.
How to Use WUE: A low WUE indicates efficient water use, vital for sustainable water resource management. Organizations can use WUE to assess their water dependence and implement water-saving measures, such as using more efficient cooling systems.
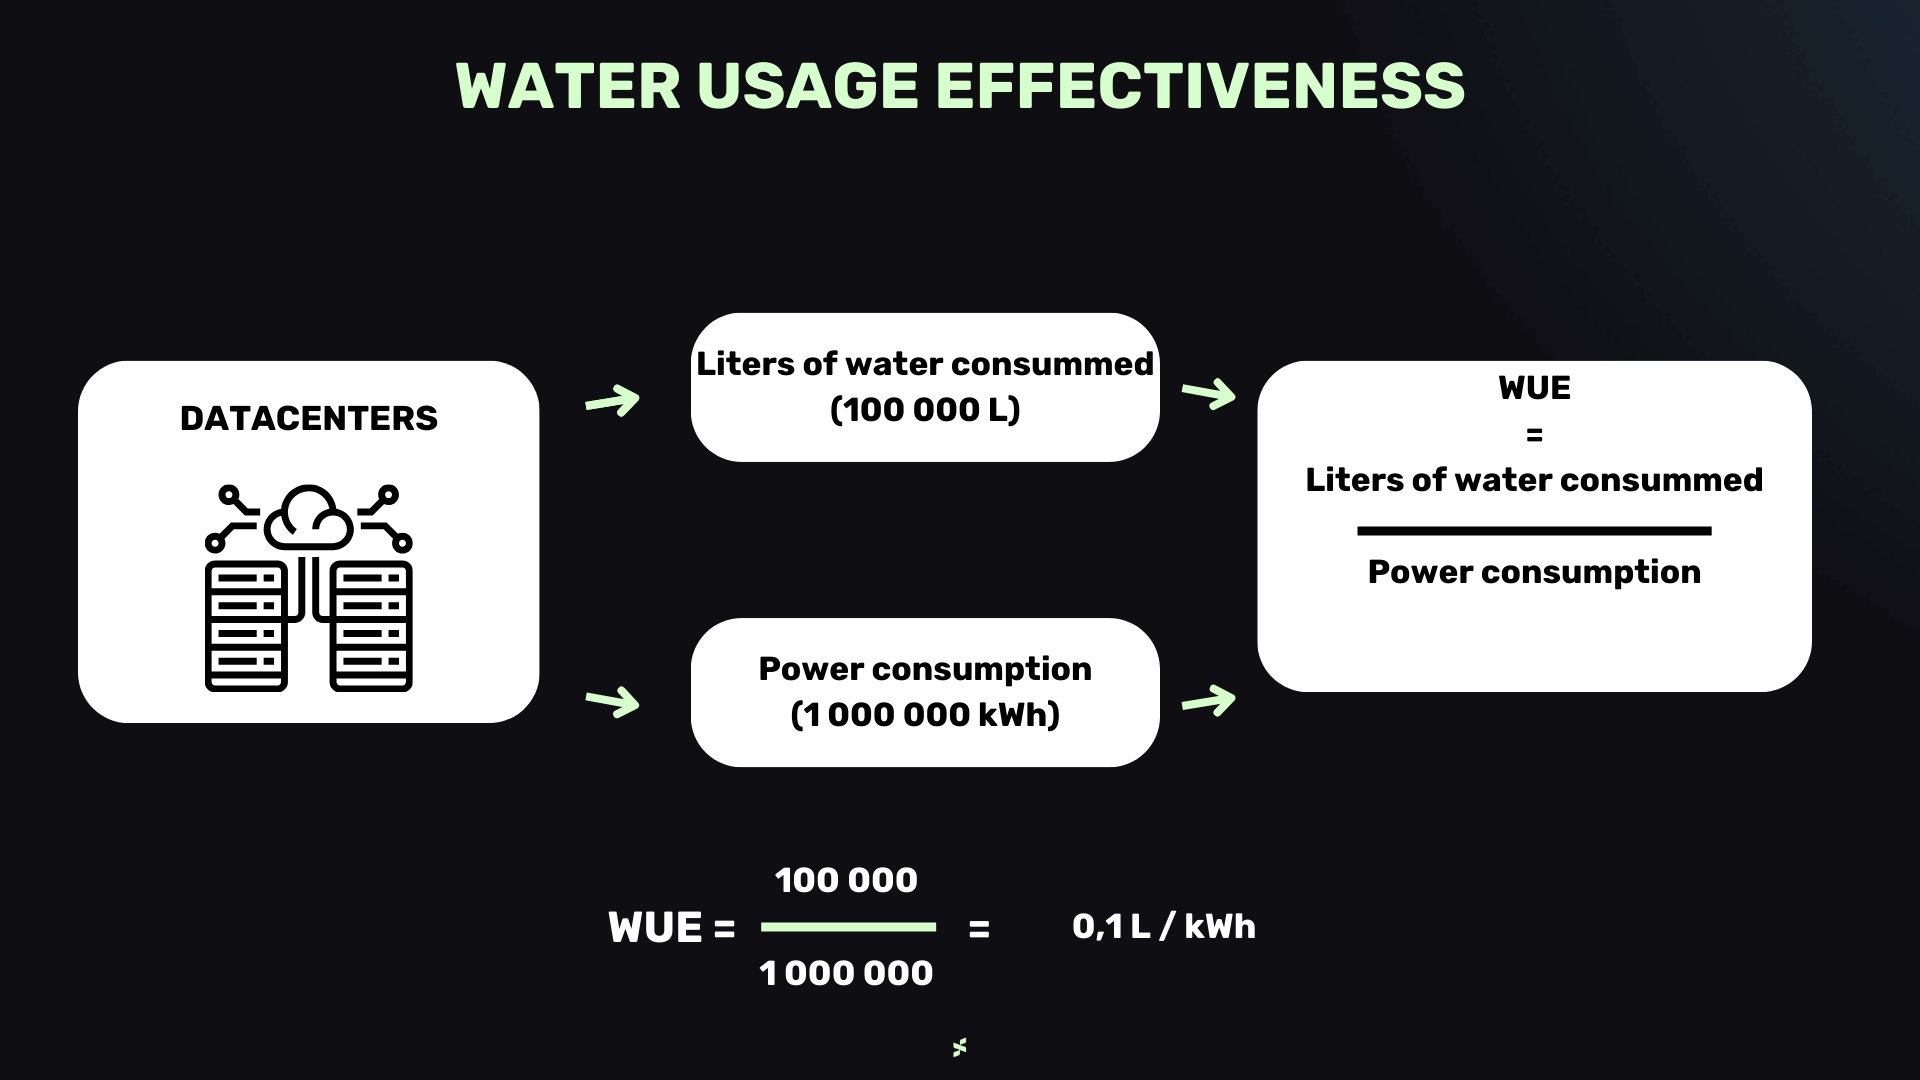
Example: If a data center consumes 100,000 liters of water per day to cool its servers and processes 1,000,000 kWh of energy per month, its WUE would be 0.1 liters per kWh (100,000 liters / 1,000,000 kWh). To improve water efficiency, the data center could invest in low-water consumption cooling technologies or recycle water to reduce overall consumption.
By understanding and utilizing these indicators (PUE, CUE, WUE), businesses and data center managers can not only monitor and evaluate the environmental performance of their facilities but also take concrete actions to reduce their impact on the environment, cut operational costs, and contribute to a more sustainable future.

While these three indicators are increasingly recognized as the norm for measuring the environmental impact of data centers, most providers are still opaque about their methodology and whether they currently implement all three.
At Sopht, we created a GreenOps solution that is the perfect way to help the environment, update your digital infrastructure and improve your finances all at once. Because going green isn’t just about being environmentally conscious; it’s about saving money, too. We offer multi-cloud monitoring to rationalize your infrastructure and related costs by measuring and comparing your different Cloud Providers environmental efficiency. Our IT asset management services allow you to consolidate, organize and pilot all data related to your IT inventory (laptops, screens, smartphones, routers…) to better amortize your carbon and financial footprint. This helps us understand how your users are interacting with their devices so that you can better manage your IT assets and plan for decarbonization.
Contact us for a demo of our new end-to-end platform.
Share this article on your networks
Data centers play a pivotal role in the digital realm, storing, managing, and providing access to data on a grand scale. However, their operations significantly impact the environment due to their high energy demands. To assess and enhance the energy efficiency of data centers, several key indicators have been developed. In this article, we delve into three of these crucial indicators: Power Usage Effectiveness (PUE), Carbon Usage Effectiveness (CUE), and Water Usage Effectiveness (WUE). Each of these indicators provides a unique perspective on the environmental performance of a data center, and understanding them is crucial to minimize environmental impact while ensuring operational efficiency.
Power Usage Effectiveness (PUE)
PUE stands as one of the most commonly used indicators to assess the energy efficiency of data centers. Developed by The Green Grid, a non-profit organization focused on data center energy efficiency.
However, PUE alone does not address electricity-related pollution, equipment usage practices, or the impact of the data center’s location, among other factors. Therefore, it should not be the sole consideration for decision-making, offering only a partial insight into a data center’s energy performance.
To delve deeper, PUE can be further broken down into different “tiers”:
-
Tier 1:
- PUE: Generally above 1.15.
- Characteristics: Basic infrastructure, but may lack significant redundancy, leading to interruptions for maintenance or repairs.
-
Tier 2:
- PUE: Generally between 1.10 and 1.15.
- Characteristics: Adds some redundancy compared to Tier 1, typically featuring redundant cooling and power systems to reduce the risk of interruptions.
-
Tier 3:
- PUE: Generally between 1.05 and 1.10.
- Characteristics: Offers considerable redundancy in power and cooling, allowing uninterrupted operation during outages or maintenance.
-
Tier 4:
- PUE: Generally between 1.02 and 1.06.
- Characteristics: The highest level of redundancy, designed to be fault-tolerant with exceptionally high availability, featuring fully redundant electrical and cooling systems to minimize disruptions.
While PUE remains a valuable tool for evaluating and improving data center energy efficiency, it has limitations:
- Sole focus on energy efficiency, neglecting other sustainability aspects.
- Dependence on precise measurement data.
- Difficulty in comparing different data centers.
- Failure to consider geographical location and climate variations.
How to Use PUE: PUE measures the total energy consumed by a data center, including servers, cooling equipment, lighting, and other loads, relative to the energy consumed only by active computer servers. A lower PUE indicates a more eco-friendly data center. According to a Uptime Institute study, the average PUE in 2021 was 1.57, compared to 2.5 in 2007.
Example: If a data center has a total energy consumption of 500 kW and server energy consumption of 350 kW, its PUE would be 1.43 (500 kW / 350 kW). This means that 43% of the total energy is used for non-server needs. The goal would be to reduce this proportion by improving overall energy efficiency.

Carbon Usage Effectiveness (CUE)
CUE measures the carbon footprint of a data center by assessing CO2 emissions per unit of energy consumed. It considers both direct and indirect emissions associated with the entire life cycle of the energy used.
However, it is challenging to take this indicator seriously due to the myriad methods allowed in carbon accounting, with no established standard. It also does not account for the carbon emissions impact related to construction, purchase of IT equipment, or their transportation.
How to Use CUE: A low CUE indicates that the data center produces few CO2 emissions per unit of energy, desirable for reducing environmental impact. Organizations can use CUE to track progress toward more environmentally friendly operations and determine if adjustments are necessary to reduce carbon emissions.
Example: Suppose a data center emits 500 tons of CO2 per year and consumes 1,000,000 kWh of electricity. Its CUE would be 0.5 kg of CO2 per kWh (500,000 kg / 1,000,000 kWh). To reduce its carbon footprint, the data center could consider using renewable energy sources or improving the energy efficiency of its infrastructure.

Water Usage Effectiveness (WUE)
WUE assesses a data center’s water consumption by dividing it by the unit of energy produced or processed. This indicator measures the efficient use of water in data center operations.
On its own, WUE has limited relevance, gaining value only when used in conjunction with other indicators. Moreover, it is still infrequently employed, making comparisons challenging.
However, accurately measuring WUE is crucial to avoid disasters like Microsoft’s in 2022 after the underestimation of water consumption in one of its data centers in the Netherlands.
How to Use WUE: A low WUE indicates efficient water use, vital for sustainable water resource management. Organizations can use WUE to assess their water dependence and implement water-saving measures, such as using more efficient cooling systems.
Example: If a data center consumes 100,000 liters of water per day to cool its servers and processes 1,000,000 kWh of energy per month, its WUE would be 0.1 liters per kWh (100,000 liters / 1,000,000 kWh). To improve water efficiency, the data center could invest in low-water consumption cooling technologies or recycle water to reduce overall consumption.
By understanding and utilizing these indicators (PUE, CUE, WUE), businesses and data center managers can not only monitor and evaluate the environmental performance of their facilities but also take concrete actions to reduce their impact on the environment, cut operational costs, and contribute to a more sustainable future.

While these three indicators are increasingly recognized as the norm for measuring the environmental impact of data centers, most providers are still opaque about their methodology and whether they currently implement all three.
At Sopht, we created a GreenOps solution that is the perfect way to help the environment, update your digital infrastructure and improve your finances all at once. Because going green isn’t just about being environmentally conscious; it’s about saving money, too. We offer multi-cloud monitoring to rationalize your infrastructure and related costs by measuring and comparing your different Cloud Providers environmental efficiency. Our IT asset management services allow you to consolidate, organize and pilot all data related to your IT inventory (laptops, screens, smartphones, routers…) to better amortize your carbon and financial footprint. This helps us understand how your users are interacting with their devices so that you can better manage your IT assets and plan for decarbonization.
Contact us for a demo of our new end-to-end platform.

